
Cross-currency basics 1 - Pricing for users
Cross-currency swaps are an integral component of risk management for many firms. They efficiently convert assets or liabilities in one currency to another through matching interest rate and notional cashflows and are essential to the efficient workings of modern capital movements. While they are used regularly, the pricing of these swaps can be opaque and confusing.
The mechanics of cross currency swaps have been covered in may posts including Clarus 2017 for IBOR/IBOR and 2021 for the new, RFR-based swaps. The move to RFR/RFR trading has progressed very quickly in line with the ARRC recommendations from July 2021 which basically put a date of 24 September 2021 for LIBORs and ‘late 2021’ for other IBORs to move from using LIBOR in one or both legs to the RFR equivalent.

The Clarus post from December 2021 has summarised the progress of many currencies. The LIBOR currencies (CHF, GBP, JPY, and USD) have been (almost) universally traded as RFR/RFR from October 2021 in line with the ARRC recommendations. Other IBORs are also moving to RFR/RFR with EUR, CAD and Scandies dominated by RFRs rather than their existing IBORs. AUD is the standout with BBSW (the AUD IBOR) dominating trading, no doubt due to the local preference for BBSW. We are yet to see how the dominant USA markets will ultimately trade AUD/USD.
This blog will not cover these developments, rather I will look at some of the pricing challenges and how these can impact users of the cross-currency markets.
Quote conventions
Cross currency swaps are now generally quoted against USD SOFR. The margin, or spread, is applied to the non-USD leg as a number of basis points, for example for USD/JPY,
SOFR/TONA - 30 with ‘-30’ being the spread. This spread can be positive or negative and will typically vary across the tenors of the swaps.
Where the cross-currency swap has two non-USD legs (e.g., AUD/JPY) then the spread can be on either leg. In this case it is wise to be very certain which leg has the spread!
Term structure of cross currency swap spreads
In most currency pairs, the spread varies across the tenors and is not always monotonic (i.e., always changes in one direction as tenor increases). Some currency pairs have unusual term structures with peaks and troughs arising at different points along the curve.
The following chart I found on the internet shows this structure quite clearly.
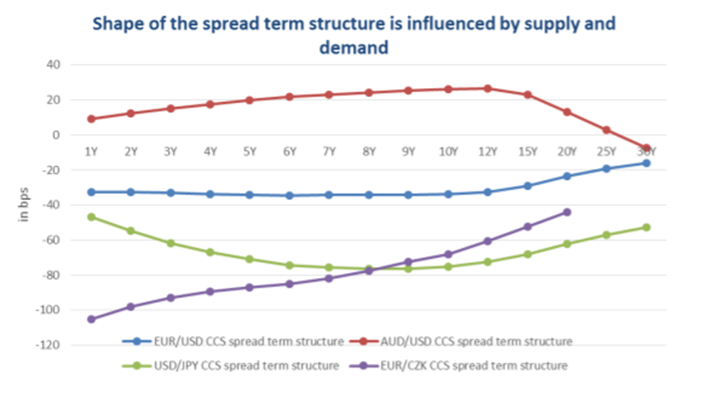
AUD/USD rises to a peak of ~20 at around 10-12-years but then falls to ~-5 at 30-years. EUR/USD is flat to 12-years but then rises to 30-years while USD/JPY falls to 8-years and then rise to 30-years.
Why do they have different shapes? This is primarily driven by supply and demand at different tenors.
Shorter tenors, say less than 2-years are generally dominated by liquidity requirements. These can change quickly, and these tenors can see quite a bit of volatility as supply or demand for one or both currencies drives the market spread. For example, in the GFC, demand for USD was intense which caused currencies like EUR to move to very negative spreads as market participants borrowed the USD and lent the EUR to fund their USD requirements through FX Forwards and cross-currency swaps.
The middle tenors, say 2 – 10 years are often dominated by medium-term debt issuance. Currencies where the domestic firms issue offshore and swap the proceeds back to their home currency (like AUD) will have demand to borrow the domestic currency via the cross-currency swap. This typically results in an upward-sloping curve in these tenors. The opposite is true for currencies such as JPY where the investors are buying offshore assets and creating the onshore asset via the cross-currency swap.
Tenors greater than 10-years are often influenced by structured, long-dated products and their market demand. For example, at the time of the chart above, a number of very long-dated AUD/JPY FX options were embedded in structured products and then hedged in the cross-currency markets. This led to lower 30-year spreads in AUD/USD and higher spreads in USD/JPY cross currency markets as the demand was all from a single direction, driven by yield-starved savers within Japan.
Supply and demand vary considerably across currencies and tenors and will also change over time.
Why do some currencies have positive spreads while others are negative?
Much like the tenor arguments above, this is primarily a supply and demand issue.
Countries with structural requirements to borrow offshore will typically have positive spreads. The buyside, such as firms who issue the offshore debt, will receive the USD and pay the local currency such as AUD. This drives the spreads positive and consistent mid-tenor demand will tend to keep them positive.
Countries with more demand to invest in offshore assets will tend to hedge these in cross-currency swaps by paying the offshore currency and receiving the domestic currency. Japan is a very good example of this tendency, and we can readily see this as negative spreads in the cross-currency swaps as they lend into the JPY leg of the swap pushing spreads negative across most tenors.
Calculating spread margins for buy-side clients
When hedging assets or liabilities, many buy-side firms will try to exactly match the cashflows on their offshore currency. For example, an issuer of a USD fixed rate 5-year MTN would prefer to match the fixed coupons and express the spread in their own, domestic currency.
The following example is for AUD/USD (where this is common).
The buy-side firm:
1) Issues USD debt fixed rate
2) Enters cross-currency swap where:
a. Issuer receives USD fixed rate to align and offset debt coupons.
b. Issuer pays AUD floating rate plus margin M1.
The sell-side counterparty will look at it like this:
1) Pay USD fixed rate/ receive AUD floating rate plus margin M1 with Issuer.
2) Price and hedge by:
a. Receive USD fixed rate/pay USD floating rate plus margin M2 (based on the fixed rate of the issue and the prevailing market rate).
b. Receive USD SOFR plus margin M2/pay AUD floating rate plus margin M1
The sell-side counterparty will calculate M1 based on the market rates current at that time.
Convexity
When calculating M1, the sell-side counterparty must use M2 from the USD single currency swap and the prevailing AUD/USD cross-currency spreads, USD SOFR/ AUD + M3.
We have an equation which looks like this:
1) AUD/USD market: USD flat/ AUD + M3.
2) Add M2 to the USD side: USD + M2/AUD + M1.
3) Solve for M1.
4) Note that unhelpfully, M1 ≠ M2 + M3 because of ‘convexity’.
The convexity arises because the discounting rates in AUD and USD are different so the present value (PV) of 1 basis point in USD ≠ PV of 1 basis point in AUD. When converting spread points on one currency to the equivalent in another currency, this difference must be accounted for.
When the spreads are large (say 100 basis points) and/or the discount rates are very different (e.g., AUD and JPY) then the solution for M1 in point 3 may be very different to the simplistic approach in point 4.
This problem is very real in crosses such as AUD/JPY. Both refer to the USD curve, but the cross will have a margin on both the AUD and JPY legs of the swap when combined. This needs to be resolved correctly in the pricing and convexity can be a confusing factor in the final rate.
XVAs
My last point in this blog is about the XVAs.
Many buy-side participants may not collateralise their derivatives and are therefore subject to CVA and FVA (and perhaps other XVAs) adjustments to the cross-currency pricing. These adjustments can be very large and sometimes dominate the spread shown to the buyer without these adjustments. FVA in particular can be very positive or negative depending on the currency pair and the direction of the trade.
Since XVAs can be so significant, buy-side firms should be vigilant on their pricing and implications to the outcomes.
Summary
The pricing of cross-currency swaps is often a complex and opaque process for many firms.
Currency pairs and crosses have different spreads across tenors and often different term spread profile
Some have positive and some have negative spreads
Convexity will be important when dealing with larger spreads used to properly hedge exposures such as debt issues.
XVAs can be a significant input to the pricing.
Martialis has significant expertise in pricing derivatives including cross-currency swaps.
We also work closely with Tokenhouse which is a new company established to address the buy-side challenges of structuring and pricing derivatives and wider treasury products. We will bring more news on this later.
Cross-currency swaps are a very useful product for many firms both buy and sell-side. Understanding the dynamics of pricing and the impact on the final trade is essential to getting a fair and appropriate outcome.