
Cross currency basics 3 - Pricing and Revaluation Rate Sources
On 5 and 19 January 2022 I posted blogs looking at the basic features and some pricing examples of cross-currency markets. The focus was on the ways in which end users of cross currency swaps price and transact in the markets. In many cases, the concepts can be complex to understand, and the pricing can be difficult to unravel.
Many users are currently experiencing significant revaluation issues as the markets change from using USD LIBOR to USD SOFR as the basis for pricing. Screens and data sources are often unclear on which reference rate is being used. Pages and tickers that may have been sourced for many years have changed their reference rates which can cause disruption in the revaluation process. This can lead to differences in collateral requirements and accounting entries.
This blog looks at several currencies where the connection between the Risk-Free Rate (RFR) and LIBOR versions of the cross-currency market quotes may be less than clear. As the reference rates and market conventions change then what you see on a screen can also change.

Current market conventions
Cross-currency market quotes were, until late 2021, quoted against USD LIBOR and the currency IBOR. The ‘SOFR First’ effort of late 2021 encouraged cross-currency markets in the LIBORs to move to RFRs in late September 2021 and other, non-LIBOR currencies in December 2021. Now (February 2022), cross-currency swaps are commonly referenced to USD SOFR and the currency RFR.
Examples are:
Up to late 2021 Current
EUR/USD LIBOR/Euribor SOFR/€STR
GBP/USD LIBOR/LIBOR SOFR/SONIA
JPY/USD LIBOR/LIBOR SOFR/TONA
AUD/USD LIBOR/BBSW SOFR/BBSW
CAD/USD LIBOR/CDOR SOFR/CDOR and SOFR/CORRA
The two standouts are AUD and CAD.
In the AUD case, the markets currently adopt a mis-match approach with the AUD leg continuing with BBSW rather than AONIA (RFR).
CAD is quoting both CDOR and CORRA (RFR) but has announced the discontinuation of CDOR so I expect CORRA to prevail in the near future.
Other markets have local IBORs still being used mainly because of a lack of viable RFRs.
Pricing differences
How do the new quotes appear relative to the old versions? The following table might help with examples for the 5-year cross currency (XCCY) swaps. It shows the actual quotes for cross-currency trades and the LIBOR rates derived from the quotes and the relevant IBOR/RFR basis swaps.

Firstly a few key notes:
The IBOR/RFR spread for GBP and JPY is fixed since the LIBOR pre-cessation announcement on 5 March 2021
Other IBOR/RFR spreads are market rates
The quoted rate does differ (column 4) from the derived rate (column 6) particularly in the JPY/USD. I suspect the market quotes are using a simple calculation (i.e., subtracting the currency IBOR/RFR from the SOFR/LIBOR spread) and perhaps do not fully adjust for convexity. This will make a larger difference in JPY due to the interest rate differential between JPY and USD.
Quote implications for users
When you price a new trade or revalue an existing trade, it is essential you understand the quote basis of your price. The quote difference (column 5) shows how much the quotes can differ between the LIBOR (column 4) and RFR (column 2) versions.
In several cases, the actual reference rates are not clear in the screen quotes which can make the process of using the correct basis somewhat challenging for some users. Certainly, we have seen this when advising our clients.
System implications for users
Booking and valuation systems are also challenging for many users. If the quotes are using different reference rates to your trades, then they must be correctly transformed into the ones required. For example, if your trade is USD LIBOR/ Euribor and the quoted price is SOFR/€STR then your system will need some additional basis swaps, SOFR/LIBOR and €STR/Euribor, and the algorithm to incorporate them into the valuations to make all this work.
In many cases, systems are simply unable to use multiple basis swaps because they have not been updated with the required patches. When this situation occurs, the calculations must be performed ex-system and the required cross-currency basis swaps (e.g., LIBOR/Euribor) then used for revaluation.
This is a complex, manual process but cannot be avoided if the system cannot manage the new quotes.
Summary
Moving from the LIBOR/IBOR cross-currency market quotes to the new quotes has been a challenging process for many users.
Many quotes are now based on SOFR but many trades still reference USD LIBOR, at least until 30 June 2023. Some quotes use the currency RFR while others use the existing IBOR (AUD). Some are in the process of moving from the currency IBOR to the RFR (CAD).
It is essential to get the pricing and revaluations correct to ensure the accounting entries are accurate and collateral calculations, where required, will align with those of the counterparty.
Systems for pricing and recording cross-currency swaps often need to be updated. Where this is not possible, then some calculations will have to be done outside the system and the required rates then entered into your system in a second step.
Martialis is actively supporting our clients in this effort. We are seeing quite a few challenges, but careful analysis and planning can make the transition to new cross-currency markets and quotes a little less painful.
Cross currency basics 2 - Pricing and convexity
On 5 January 2022 I posted a blog looking at some basic features of cross-currency swaps. I included quote conventions, term structure, positive/negative spreads, convexity, calculating margins and XVAs. This was a lot to cover in a single article, but these are important building blocks for a better understanding of this important product.
This time I will look more at some practical examples of how to price some swaps. I will not go into great depth on the actual pricing process, but I will find a few examples to demonstrate the convexity and crosses. I will also cover the differences between IBOR (including LIBOR) and RFR (Risk Free Rates) pricing; a topical subject at the moment.
The RFR-based cross-currency swap markets are developing quickly so we need to be very aware of how this affects the pricing. The Clarus posts from December 2021 for the new, RFR-based swaps were also covered by Risk in January 2022 and they both really show how RFRs are replacing LIBOR (and other IBORs) in many markets. You can still access LIBORs, but they will be using fallbacks (usually to ISDA) after a cessation or pre-cessation event.
This mix-and-match approach is making it difficult for many firms to accurately price cross-currency swaps. Pricing inputs are changing, and revaluation curves need to be kept up to date. System compatibility issues are a constant concern as we move to new pricing input conventions.

Convexity and pricing
Let us take a simple example to see the impact of convexity on the pricing for a 5-year AUD/USD cross-currency swap. We will use the current convention of SOFR/BBSW for this example. All the spreads are in basis points.
USD/AUD (RFR/IBOR)
Base curve USD SOFR flat / AUD BBSW (3-month) + 4
Now we add 100 bps to the USD SOFR rate to match an actual cashflow from, for example, a debt issue.
Trade rate USD SOFR + 100 / AUD BBSW (3-month) + 106.5
The AUD spread is 106.5 bps which is higher than the simple estimate of 4 + 100 = 104 bps.
This is convexity in practice. The 5-year SOFR rate is 1.40% and the 5-year AUD BBSW rate is 1.76%. The additional 0.36% (1.76 – 1.40) makes a difference of 2.5 bps over the 5 years. The higher rate for AUD (and therefore a higher discounting rate) than that of USD leads to this outcome.
But just one technical note, remember the SOFR and BBSW are different basis, respectively 360 and 365 days which must also respected.
EUR/USD (RFR/RFR)
Next example: EUR/USD cross currency.
Base curve USD SOFR flat / EUR €STR - 18
Now we add 100 bps to the USD SOFR rate to match an actual cashflow, say from a debt issue.
Trade rate USD SOFR + 100 / EUR €STR + 77.8
The EUR spread is 77.8 bps which is 4.2 bps lower than the simple estimate of -18 + 100 = 82 bps.
The 5-year SOFR rate is 1.40% and the 5-year €STR rate is -.05%. The additional 1.45% (1.40 + 0.05) makes a difference of -4.2 bps over the 5 years. This time, the convexity adjustment is negative because EUR rates are lower than USD rates.

JPY/AUD (RFR/IBOR)
Finally, something a little more radical; JPY/AUD cross currency. We will stay with the theme and use TONA/BBSW for the floating rates.
Base curve JPY TONA flat / AUD BBSW (3-month) + 58
Now we add 100 bps to the USD SOFR rate to match an actual cashflow, say from a debt issue.
Trade rate JPY TONA + 100 / AUD BBSW (3-month) + 164.75
The AUD spread is 164.75 bps or 6.75 bps higher than the estimate of 58 + 100 = 158 bps.
The 5-year TONA rate is 0.04% and the 5-year AUD BBSW rate is 1.76%. The additional 1.72% (1.76 - 0.04) makes a difference of 6.75 bps over the 5 years.
The message in all of this is clear; the calculations need to be done properly and with great care, otherwise, your pricing may be significantly different to the correct outcome.
The cross-currency debate: is the EUR leg adopting €STR or Euribor as the convention?
At the time of this blog, the EUR/USD cross-currency swaps are being routinely quoted in the interdealer markets as €STR/SOFR even though Euribor is still published. There are many reasons why this is the case including the (generally) lower volatility of the RFR/RFR spreads when compared with RFR/IBOR. I will return to the volatility question in a future blog, but the fact remains, €STR/SOFR seems to dominate.
As above, the EUR/USD cross currency swap is quoted (€STR/SOFR) as:
Base curve USD SOFR flat / EUR €STR - 18
The basis swaps are:
SOFR/Euribor USD SOFR flat / EUR Euribor - 31.25
LIBOR/Euribor USD SOFR flat / EUR Euribor - 9.5
The math is straight forward and there are some convexity differences as well.
EUR Euribor / €STR + 13.25 -> USD SOFR flat / EUR €STR – 31.25 (- 18 - 13.25)
USD LIBOR / SOFR + 22.9 -> USD SOFR flat / EUR Euribor – 8.35 (- 31.25 + 22.9)
Our simple calculation shows the approximation of - 8.35 is similar to the market rate of - 9.5. However, it is not exact, and we can again see the impact of convexity.
Pricing properly is the key. Approximations are a great idea to check to price, but a full calculation is always the best approach.
Mix-and-match
As I described in the previous blog, conventions vary across currencies. While the LIBOR currencies and EUR have moved convincingly to the RFR/RFR convention, others are at different stages and are using various conventions.
Local preferences can be important (e.g., AUD) where the RFR/IBORs persist. However, this may change as inter-dealer markets eventually settle on conventions where markets are most liquid.
The best approach is to be very clear about your pricing inputs:
What is the basis? RFR/RFR or something else?
How is your pricing process geared to deal with different inputs and basis?
Is your revaluation system and process correctly using new curves?
As the cross-currency markets evolve and change, many firms will have challenges keeping abreast of the issues and will need to adjust their processes accordingly.
Summary
Many buy-side firms use cross-currency swaps to hedge assets and/or liabilities in non-domestic markets. This often results in large basis point spreads in the offshore currency which are then converted to the home currency plus/minus a spread. It is the combination of large spreads and different discounting rates that can create the convexity problem.
It is good practice to perform the simple calculation to get a ‘ballpark’ estimate of the likely outcome of a pricing calculation. While this help establish the approximate spread, the full and correct calculation must be performed to check pricing.
Cross-currency markets are changing, and the quoted price may not always be the one you have been using previously. A mix of RFR/RFR, RFR/IBOR and IBOR/IBOR conventions are all in the markets now. Proper alignment of the pricing and revaluation systems is essential and often quite complex. Incorrect inputs and calculations can cause issues with deal pricing and agreeing collateral amounts if not managed carefully.
As always, Martialis has significant expertise in pricing derivatives including cross-currency swaps. Let us know if you need some assistance or just want to check a few points.
Cross-currency basics 1 - Pricing for users
Cross-currency swaps are an integral component of risk management for many firms. They efficiently convert assets or liabilities in one currency to another through matching interest rate and notional cashflows and are essential to the efficient workings of modern capital movements. While they are used regularly, the pricing of these swaps can be opaque and confusing.
The mechanics of cross currency swaps have been covered in may posts including Clarus 2017 for IBOR/IBOR and 2021 for the new, RFR-based swaps. The move to RFR/RFR trading has progressed very quickly in line with the ARRC recommendations from July 2021 which basically put a date of 24 September 2021 for LIBORs and ‘late 2021’ for other IBORs to move from using LIBOR in one or both legs to the RFR equivalent.

The Clarus post from December 2021 has summarised the progress of many currencies. The LIBOR currencies (CHF, GBP, JPY, and USD) have been (almost) universally traded as RFR/RFR from October 2021 in line with the ARRC recommendations. Other IBORs are also moving to RFR/RFR with EUR, CAD and Scandies dominated by RFRs rather than their existing IBORs. AUD is the standout with BBSW (the AUD IBOR) dominating trading, no doubt due to the local preference for BBSW. We are yet to see how the dominant USA markets will ultimately trade AUD/USD.
This blog will not cover these developments, rather I will look at some of the pricing challenges and how these can impact users of the cross-currency markets.
Quote conventions
Cross currency swaps are now generally quoted against USD SOFR. The margin, or spread, is applied to the non-USD leg as a number of basis points, for example for USD/JPY,
SOFR/TONA - 30 with ‘-30’ being the spread. This spread can be positive or negative and will typically vary across the tenors of the swaps.
Where the cross-currency swap has two non-USD legs (e.g., AUD/JPY) then the spread can be on either leg. In this case it is wise to be very certain which leg has the spread!
Term structure of cross currency swap spreads
In most currency pairs, the spread varies across the tenors and is not always monotonic (i.e., always changes in one direction as tenor increases). Some currency pairs have unusual term structures with peaks and troughs arising at different points along the curve.
The following chart I found on the internet shows this structure quite clearly.
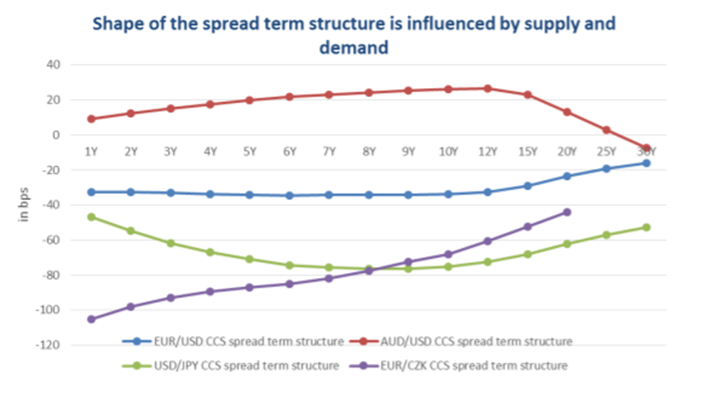
AUD/USD rises to a peak of ~20 at around 10-12-years but then falls to ~-5 at 30-years. EUR/USD is flat to 12-years but then rises to 30-years while USD/JPY falls to 8-years and then rise to 30-years.
Why do they have different shapes? This is primarily driven by supply and demand at different tenors.
Shorter tenors, say less than 2-years are generally dominated by liquidity requirements. These can change quickly, and these tenors can see quite a bit of volatility as supply or demand for one or both currencies drives the market spread. For example, in the GFC, demand for USD was intense which caused currencies like EUR to move to very negative spreads as market participants borrowed the USD and lent the EUR to fund their USD requirements through FX Forwards and cross-currency swaps.
The middle tenors, say 2 – 10 years are often dominated by medium-term debt issuance. Currencies where the domestic firms issue offshore and swap the proceeds back to their home currency (like AUD) will have demand to borrow the domestic currency via the cross-currency swap. This typically results in an upward-sloping curve in these tenors. The opposite is true for currencies such as JPY where the investors are buying offshore assets and creating the onshore asset via the cross-currency swap.
Tenors greater than 10-years are often influenced by structured, long-dated products and their market demand. For example, at the time of the chart above, a number of very long-dated AUD/JPY FX options were embedded in structured products and then hedged in the cross-currency markets. This led to lower 30-year spreads in AUD/USD and higher spreads in USD/JPY cross currency markets as the demand was all from a single direction, driven by yield-starved savers within Japan.
Supply and demand vary considerably across currencies and tenors and will also change over time.
Why do some currencies have positive spreads while others are negative?
Much like the tenor arguments above, this is primarily a supply and demand issue.
Countries with structural requirements to borrow offshore will typically have positive spreads. The buyside, such as firms who issue the offshore debt, will receive the USD and pay the local currency such as AUD. This drives the spreads positive and consistent mid-tenor demand will tend to keep them positive.
Countries with more demand to invest in offshore assets will tend to hedge these in cross-currency swaps by paying the offshore currency and receiving the domestic currency. Japan is a very good example of this tendency, and we can readily see this as negative spreads in the cross-currency swaps as they lend into the JPY leg of the swap pushing spreads negative across most tenors.
Calculating spread margins for buy-side clients
When hedging assets or liabilities, many buy-side firms will try to exactly match the cashflows on their offshore currency. For example, an issuer of a USD fixed rate 5-year MTN would prefer to match the fixed coupons and express the spread in their own, domestic currency.
The following example is for AUD/USD (where this is common).
The buy-side firm:
1) Issues USD debt fixed rate
2) Enters cross-currency swap where:
a. Issuer receives USD fixed rate to align and offset debt coupons.
b. Issuer pays AUD floating rate plus margin M1.
The sell-side counterparty will look at it like this:
1) Pay USD fixed rate/ receive AUD floating rate plus margin M1 with Issuer.
2) Price and hedge by:
a. Receive USD fixed rate/pay USD floating rate plus margin M2 (based on the fixed rate of the issue and the prevailing market rate).
b. Receive USD SOFR plus margin M2/pay AUD floating rate plus margin M1
The sell-side counterparty will calculate M1 based on the market rates current at that time.
Convexity
When calculating M1, the sell-side counterparty must use M2 from the USD single currency swap and the prevailing AUD/USD cross-currency spreads, USD SOFR/ AUD + M3.
We have an equation which looks like this:
1) AUD/USD market: USD flat/ AUD + M3.
2) Add M2 to the USD side: USD + M2/AUD + M1.
3) Solve for M1.
4) Note that unhelpfully, M1 ≠ M2 + M3 because of ‘convexity’.
The convexity arises because the discounting rates in AUD and USD are different so the present value (PV) of 1 basis point in USD ≠ PV of 1 basis point in AUD. When converting spread points on one currency to the equivalent in another currency, this difference must be accounted for.
When the spreads are large (say 100 basis points) and/or the discount rates are very different (e.g., AUD and JPY) then the solution for M1 in point 3 may be very different to the simplistic approach in point 4.
This problem is very real in crosses such as AUD/JPY. Both refer to the USD curve, but the cross will have a margin on both the AUD and JPY legs of the swap when combined. This needs to be resolved correctly in the pricing and convexity can be a confusing factor in the final rate.
XVAs
My last point in this blog is about the XVAs.
Many buy-side participants may not collateralise their derivatives and are therefore subject to CVA and FVA (and perhaps other XVAs) adjustments to the cross-currency pricing. These adjustments can be very large and sometimes dominate the spread shown to the buyer without these adjustments. FVA in particular can be very positive or negative depending on the currency pair and the direction of the trade.
Since XVAs can be so significant, buy-side firms should be vigilant on their pricing and implications to the outcomes.
Summary
The pricing of cross-currency swaps is often a complex and opaque process for many firms.
Currency pairs and crosses have different spreads across tenors and often different term spread profile
Some have positive and some have negative spreads
Convexity will be important when dealing with larger spreads used to properly hedge exposures such as debt issues.
XVAs can be a significant input to the pricing.
Martialis has significant expertise in pricing derivatives including cross-currency swaps.
We also work closely with Tokenhouse which is a new company established to address the buy-side challenges of structuring and pricing derivatives and wider treasury products. We will bring more news on this later.
Cross-currency swaps are a very useful product for many firms both buy and sell-side. Understanding the dynamics of pricing and the impact on the final trade is essential to getting a fair and appropriate outcome.